In this guide
- Lake Management Budgets for Better ROI
- What a Real Lake Management Plan Contains
- Why some treatment results are short lived
- Small Treatments, Adaptive Management, and the Value of Information
- Connecting reservoir conditions with treatment-plant costs and operations
- Net present value: Why adaptive management beats large interventions
- Evidence for an oxygenation investment
- References & resources
01Lake Management Budgets for Better ROI
A lake-management budget often pays for several parts of the same problem: sampling, recurring treatments, equipment, staff time, and, for a utility, additional work at the plant. Looking at those costs together can reveal a better use of money already committed. A useful monitoring adjustment may prevent an unnecessary expansion, while a well-targeted source treatment may reduce recurring work elsewhere.
We review each activity for the decision it supports and the benefit it delivers. Compliance monitoring has a required role; a diagnostic sample should distinguish between actions; a recurring treatment should provide an outcome worth maintaining. If a program is already doing those things well, the recommendation may be a small adjustment rather than a new investigation.
ENV develops, refines, and evaluates programs that existing staff or contractors can carry out. The program-design approach described here has been used in plans for hundreds of utilities, and a focused design pass generally runs under $3,000. That isn't the price of a new field investigation or complete restoration design; we agree the available information, deliverable, and fee before starting.
Performance can be assessed across four related areas: financial cost, reliability and water-quality outcomes, public or customer impacts, and energy or resource use. Some benefits are readily priced; others are better reported as operational or ecological outcomes. A credible comparison doesn't require assigning an artificial dollar value to every benefit.
Implementation can remain with existing staff or contractors. Independent design and review can help specify what needs to be delivered, how performance will be measured, and where specialist work adds value. That gives a program a common basis for comparing proposals and evaluating results.
| Cost category | Examples | Outcome against which to assess it |
|---|---|---|
| Investigation and design | Sediment work, source budgets, treatment comparison | A decision supported by evidence before committing to an intervention |
| Implementation | Materials, application, equipment and installation | Delivery of the intended treatment to the relevant area or process |
| Continuing operation | Energy, oxygen, chemicals, maintenance, staff and residuals | Sustained water-quality improvement and reliable operation |
| Verification and adjustment | Field monitoring, analysis and independent review | Evidence that the program meets its objective and a basis for changes |
| Consequences of poor water quality | Lost access, extra treatment, interruptions and response effort | Benefits that may be avoided costs, improved service or nonmonetary ecological gains |
ENV uses these categories to compare alternatives on a common scope. Some benefits are valuable without a defensible dollar estimate. [1]
Water quality also has value beyond the treatment budget. Mamun and colleagues analyzed about 746,000 property sales around 1,632 lakes: a 1% improvement in clarity was associated with roughly a 0.18% higher home price within 100 m of a lake and about 0.05% at 100 – 300 m, with no statistically detectable effect beyond that distance. It's evidence that clearer water can matter economically, not a prediction of individual property gains or a formula for allocating a local assessment. [2]
ENV combines aquatic science with financial analysis to design and evaluate management programs. The work begins with the required outcome, the evidence available, and the costs already being incurred. It can include an existing-data review, a diagnostic investigation, treatment strategy, independent oversight, or evaluation of a proposed capital project. For sediment questions, an experienced visual assessment of the sediment at collection gives a low-cost, qualitative estimate of release risk, which decides whether more expensive laboratory analysis is worth buying.
| Outcome | Evidence to consider |
|---|---|
| Financial performance | Capital, recurring treatment, maintenance, labor, and replacement costs over a comparable period |
| Reliability | Frequency, severity, and duration of water-quality or operational disruptions |
| Public and customer benefit | Access, complaints, service quality, and clearly defined ecological outcomes |
| Resource use | Energy, chemicals, residuals, water, and the operational consequences of each option |
02What a Real Lake Management Plan Contains
A usable plan makes the next decision easier. It connects the scientific explanation with the action, the person responsible, the budget, and the evidence that will determine whether to continue. That connection should survive a change of staff or contractor, so the third year of a program is as clearly assigned as the first application.
The scientific foundation includes the lake's physical setting, major inputs, sediment behavior, seasonal water quality, biological conditions, and the routes by which those processes affect lake use or an intake. Uncertain source attribution should be identified before a particular treatment is presented as the solution.
The implementation portion connects actions with responsibilities, timing, cost, permits, and success measures. It distinguishes immediate response from longer-term prevention. It should also explain which decisions can be made now and which depend on evidence not yet available.
Monitoring belongs in the treatment budget because it tells the program what to do next. If phosphorus remains high after an application, the next step differs depending on whether the material missed a release area, an inflow replenished the lake, or the chosen chemistry was unsuitable. A plan that sets out those distinctions can turn an unexpected result into a useful adjustment.
For a reservoir supplying drinking water, the plan also connects source conditions with intake selection, treatment capabilities, operational authority, and communications. A lake-side intervention may require cooperation between organizations that control different parts of the system.
| Element | Useful content |
|---|---|
| Objectives and baseline | The water-quality, access, habitat or operational outcome; present conditions; a realistic comparison without the project |
| Source diagnosis | The important sources and processes, the evidence behind them and remaining uncertainty |
| Options and rationale | Feasible treatments, how each addresses the cause, constraints and alternatives considered |
| Implementation and cost | Responsibilities, approvals, sequence, operating needs and a multi-year cost view |
| Performance evaluation | Measures tied to the objective and comparisons that distinguish treatment from seasonal variation |
| Adaptive decisions | Conditions under which an intervention is continued, adjusted, expanded or replaced |
The plan should be specific enough to guide decisions and updateable as evidence improves. It's more than a schedule of applications. [3]
A funding application may require additional elements. For example, EPA Section 319 watershed planning commonly connects pollutant sources, load reductions, management measures, implementation resources, schedules, milestones, evaluation criteria and monitoring. Eligibility and requirements depend on the program and approving authority. A technically sound plan supports that process, but it doesn't by itself make a project eligible. [4]
ENV can prepare a new lake or reservoir management plan or revise an existing one around the decisions currently facing the program. The aim is a document that staff, contractors, and decision-makers can use, with enough scientific detail to justify the actions and enough operational detail to implement them.
EPA Section 319 grants also illustrate why funding structure needs its own review: the federal share of the state grant can't exceed 60%, requiring at least a 40% nonfederal match. States set the eligibility and pass-through terms for local projects, so that national rule isn't automatically the match a particular lake association will be offered. [4]

Talk through the decisions your management plan needs to support →
03Why some treatment results are short lived
A bloom returning after treatment isn't enough to decide whether the money was wasted. An algaecide may have delivered the short period of control it was purchased for, while a phosphorus application may have treated the water column without reaching the sediment source. We compare the intended purpose with the duration and location of the observed response before recommending another application.
These possibilities have different financial implications. Repeating a seasonal nuisance treatment may be reasonable where the benefit justifies the recurring cost. Expanding a treatment is less attractive if it's addressing a minor source while a larger one remains unchanged.
For phosphorus binders, duration depends on the reactive phosphorus pool, treatment capacity, contact, chemical conditions, disturbance, and new inputs. A limited water-column treatment shouldn't be compared with a sediment treatment designed for longer-term internal-load control solely on cost per application.
Oxygenation has a different cost structure. Capital equipment, oxygen supply or generation, energy, maintenance, and operating period all matter. The benefit depends on oxygen reaching the relevant water and sediment area and on the constituent or habitat response. Continuous equipment operation isn't evidence that the intended outcome was achieved.
Biological measures and watershed work may require more time before their effect is visible in the lake. That delay should be reflected in expectations, interim management, and verification. It shouldn't be used to make the project impossible to evaluate.
| Observed pattern | Possible explanation | Financial consequence |
|---|---|---|
| Growth declines, then returns | Standing biomass was controlled while nutrient supply continued. | Recurring control may be an intentional operating cost or evidence that source control deserves evaluation. |
| Phosphorus falls briefly | The treated water-column pool is replenished from sediment or inflows. | Cost per application misses how much of the continuing load was addressed. |
| Oxygen improves near equipment | Delivery is adequate locally but not across the required area. | Expanding capacity may not resolve a distribution problem. |
| Plant operation improves for one season | Hydrology, raw-water composition or plant settings differed. | Savings need attribution before they are used to justify a long-lived asset. |
These are competing explanations to investigate, not diagnoses from appearance alone. [5] [6] [1]
Published aluminum-treatment results illustrate the importance of context: a 114-lake analysis reported mean longevity of 11 years overall, with substantial differences between deeper stratified and shallow mixed systems. It doesn't follow that a small, budget-limited water-column application purchases eleven years of control. The relevant comparison is the source addressed and the expected performance under the proposed scope. [5]
ENV reviews the original objective, treatment record, monitoring, and alternative explanations before recommending a change. The useful result is an account of what the program achieved, what remains unresolved, and which adjustment has the strongest basis.
Money already spent shouldn't determine the next investment. An oxygen system that hasn't reduced the constituent it was intended to control needs an explanation: distribution, capacity, operating period, or the chemistry itself. That review may support better use of the existing equipment, an upgrade, a complementary treatment, or a decision to stop spending on that objective. The original capital cost doesn't choose among them.
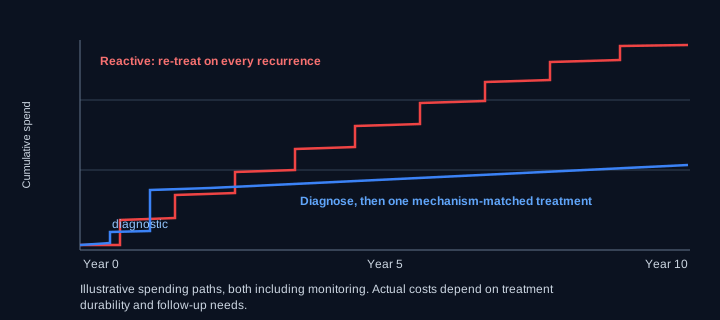
Discuss what previous treatments achieved and how long the results lasted →
04Small Treatments, Adaptive Management, and the Value of Information
The value of a small investigation comes from the larger decision it changes. If phosphorus release is concentrated in a limited part of the lake, targeted work may change both the treatment area and the budget. If oxygen delivery is adequate but poorly distributed, changing operation may be more useful than buying additional capacity. Those are the questions we want answered before a major commitment.
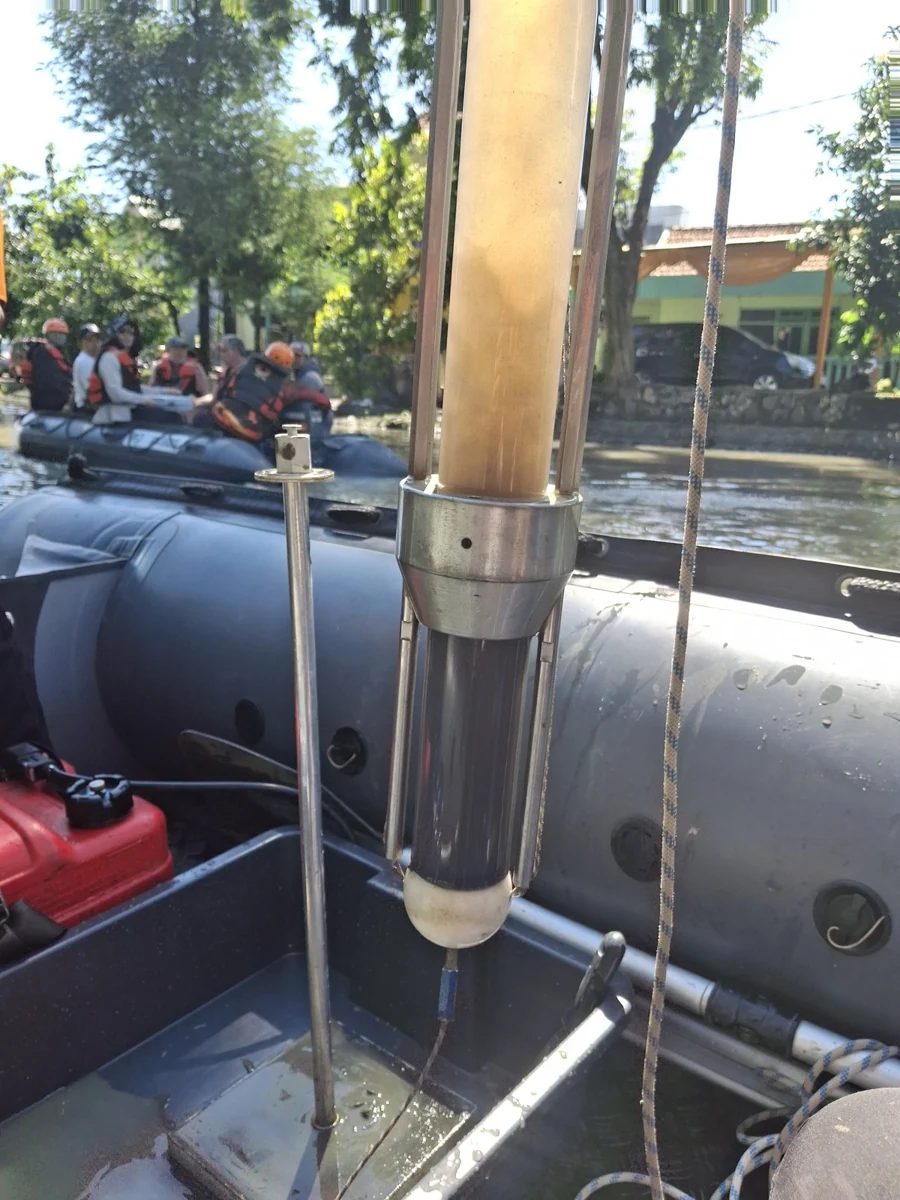
A trial has to resemble the part of the project it's meant to inform. A sheltered cove can be useful for testing a chemical response, but it won't establish how material distributes across an exposed basin. We define the inference before the trial so that a promising local result supports an appropriate next step rather than an unjustified whole-lake extrapolation.
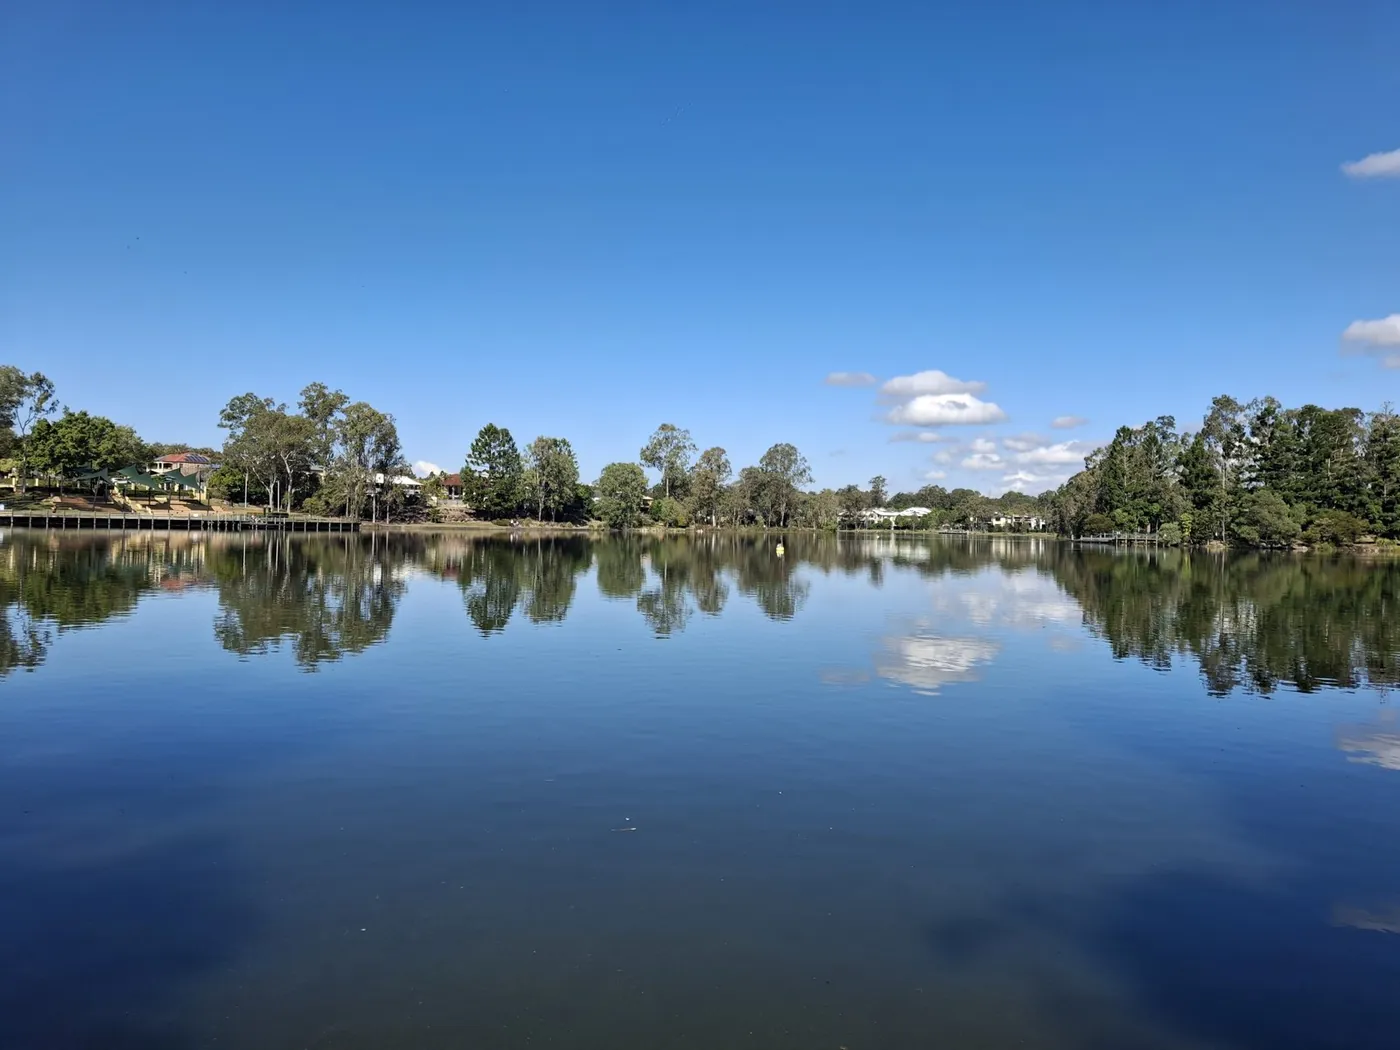
Adaptive investment can divide a program into stages while retaining a coherent long-term objective. Each stage produces evidence for the next: confirm the main source, evaluate a suitable intervention, assess the response, and adjust where necessary. The stages and their decision criteria should be agreed before results are known.
The value of information is the value of a better decision
An investigation has economic value when different plausible findings lead to different actions with different consequences. For example, a trial might distinguish an oxygen-distribution problem from insufficient total capacity. One result supports changing how existing equipment operates; the other supports additional capacity. The value is the loss avoided by choosing appropriately, after allowing for the cost of obtaining the information. [3]
That reasoning also places a limit on testing. If every plausible result leads to the same decision, or if the result arrives too late to affect it, the investigation may have little decision value. If waiting prolongs an expensive bloom or treatment-plant disruption, that delay belongs in the comparison.
| Stage | What it can establish | Why that matters financially |
|---|---|---|
| Focused diagnostic work | Whether the proposed intervention addresses an important source | Reduces the chance of purchasing an effective technology for the wrong problem |
| Representative trial or operating comparison | Whether the mechanism works under relevant conditions | Supports a more defensible scale-up or a decision to stop |
| Targeted implementation | Whether a limited area or process change achieves the objective | May avoid unnecessary scope while preserving the option to expand |
| Seasonal review | Whether benefits persist and whether sources or costs changed | Directs follow-up spending to an identified need |
Small treatments are useful when they generate interpretable evidence or meet a limited objective. Repeated under-treatment without learning isn't adaptive management. [3]
We design investigations and performance reviews to resolve uncertainties that matter financially or operationally. The resulting recommendation may be a larger treatment, a more limited intervention, continued monitoring, or no additional expenditure at that time.
05Connecting reservoir conditions with treatment-plant costs and operations
One seasonal change in a reservoir can affect several plant costs. Oxygen depletion may mobilize manganese; nutrient release can support biomass that changes coagulation and filtration; odor compounds can increase activated-carbon use. The useful financial question is which part of those costs a reservoir intervention could influence, and which treatment barriers would still be needed.
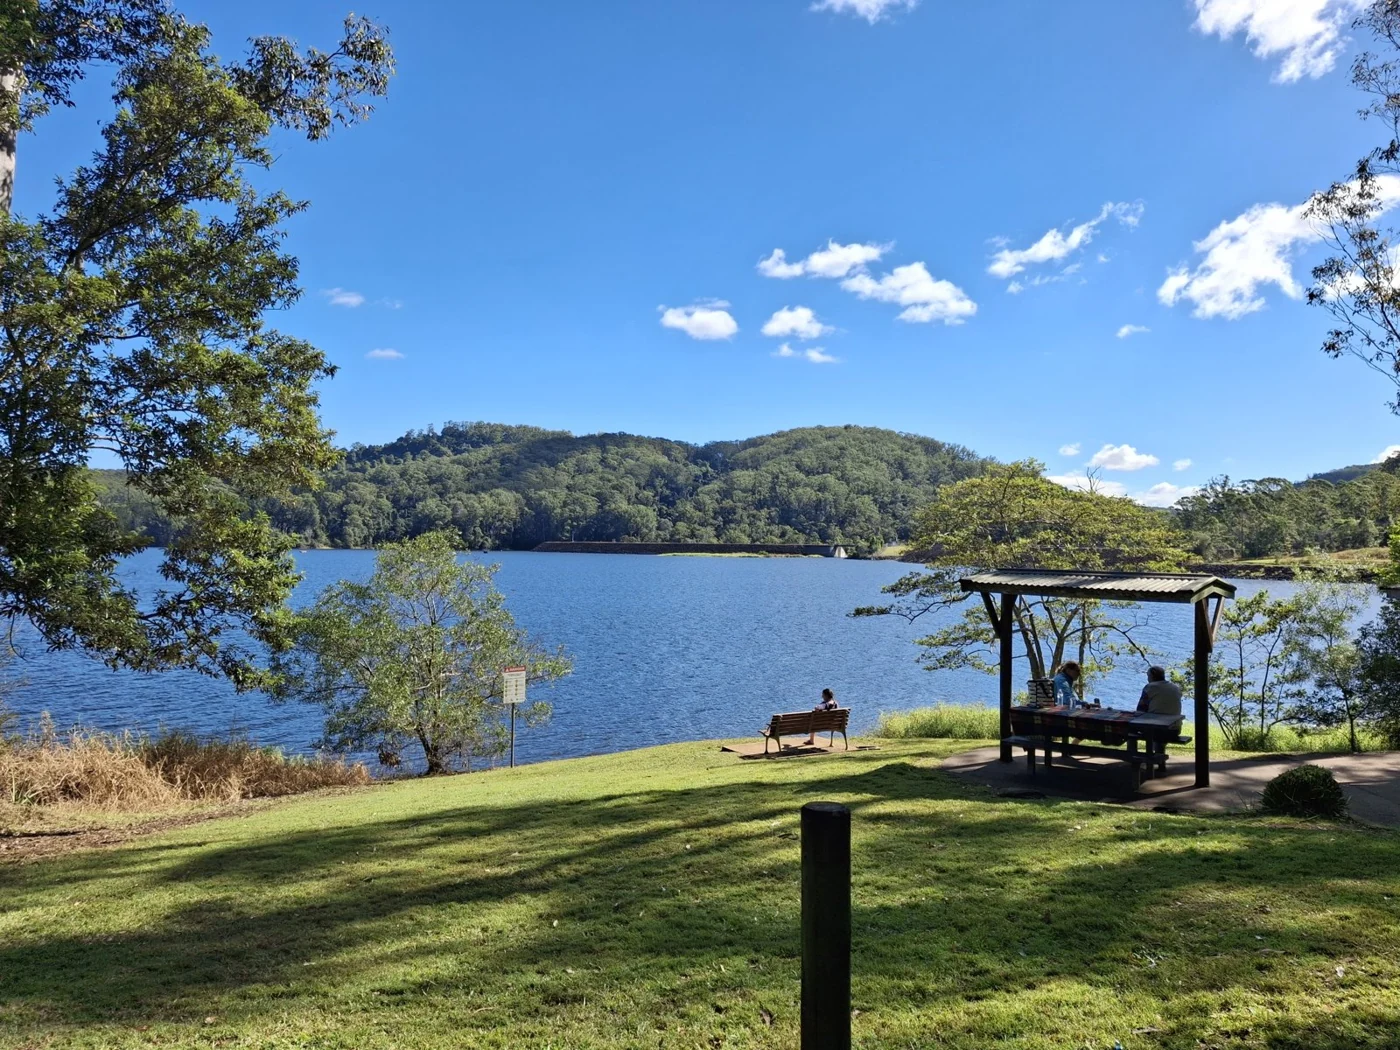
A useful evaluation aligns source-water measurements with chemical use, flow, operating changes, filter performance, residuals handling, and relevant customer or compliance outcomes. Annual totals can conceal short, expensive periods. Costs per unit of treated water help distinguish a water-quality effect from a change in production volume.
When chemical use and reservoir conditions move together, we examine the timing and the plant record before attributing the cost. A product-strength change, higher production, or a different operating target may explain part of the increase. Separating those effects leaves a more useful estimate of what improved source water could save.
The comparison between reservoir-side and plant-side investment includes both effectiveness and authority. Intake changes, oxygenation, nutrient control, activated carbon, oxidation, or additional treatment barriers may influence different parts of the problem and act on different timescales. Some source controls reduce event frequency; plant barriers may still be required for reliable protection.
Costs should include staffing, monitoring, maintenance, energy, residuals, replacement, and implementation constraints. Benefits should reflect the portion of the problem each option can reasonably influence. Avoided costs can't be counted twice across overlapping interventions.
| Reservoir condition | Plant records worth connecting | Cost or operating effect |
|---|---|---|
| Dissolved manganese, iron and other reduced constituents | Oxidant use, metal speciation, filter performance and cleaning | Chemical consumption, solids production and operational interruptions |
| Geosmin or MIB events | Compound concentrations, activated carbon use and contact conditions | Event-related carbon expense and additional monitoring |
| High cell or algal-organic-matter loading | Coagulant use, settled-water quality, filter runs and residuals | Treatment effort, backwash water, sludge and throughput |
| Cyanotoxin risk | Cell and dissolved-toxin results and barrier performance | Laboratory work, operating changes and reliability requirements |
| Changing organic-carbon character | DOC, UV absorbance, DBP precursors and process settings | Coagulation effectiveness and the constraints on oxidation or disinfection |
Interpretation depends on the actual treatment train. These are candidate relationships to evaluate, not promised savings from a reservoir intervention. [7] [8] [9] [10]
The strongest cost analysis follows individual events as well as annual totals. A short period of difficult water may account for a large share of activated carbon, overtime or lost production. Conversely, chemical expenditure may rise because production increased or prices changed. Normalizing for treated volume and identifying process changes helps isolate the portion that better source-water management could influence.
ENV can evaluate the source-water contribution to treatment costs and compare options on a consistent basis. The result is a financial and operational assessment supported by the reservoir chemistry, with assumptions visible enough to revisit as conditions change.
06Net present value: Why adaptive management beats large interventions
A recurring application can look inexpensive beside a capital project until both are compared over the same period. The reverse can also happen: a large project can look economical only because its maintenance, energy, and replacement costs are outside the original quote. We compare the full cost of delivering the required outcome, including when each payment and benefit occurs.
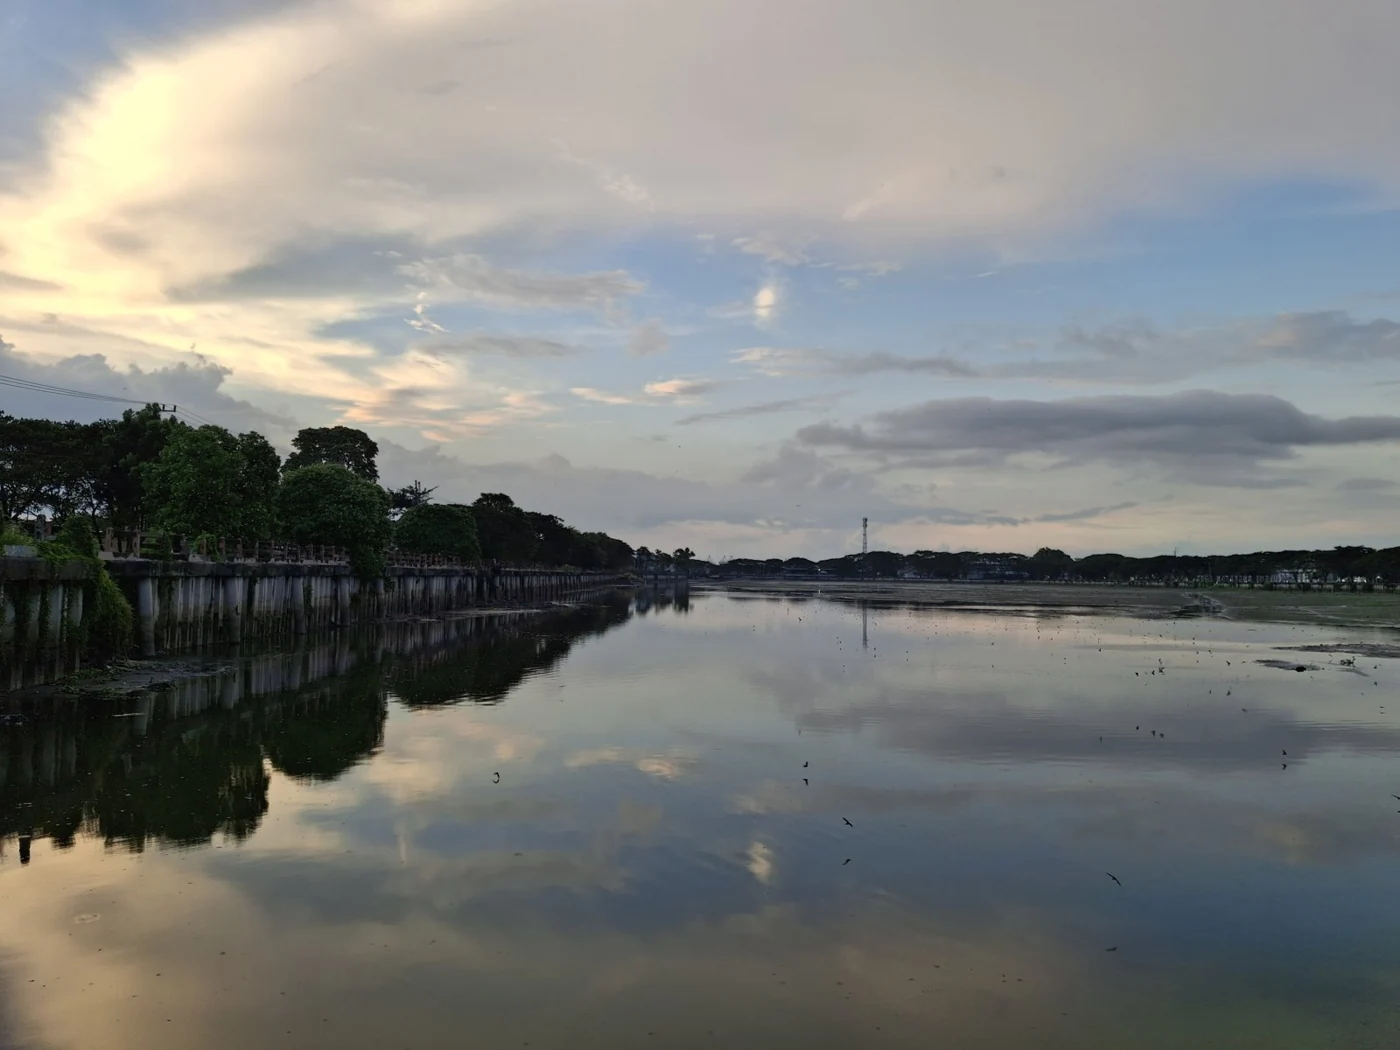
Three factors often dominate the comparison: how much of the problem the option controls, how long that benefit persists, and what must be spent to maintain it. A lower-cost application may be attractive even if it recurs. A more durable intervention may be worthwhile where it reduces substantial recurring costs. Neither conclusion follows from price alone.
Financial evaluation should test plausible ranges for treatment duration, energy and chemical costs, future loading, maintenance, and effectiveness. An option that looks best only under one optimistic assumption deserves a different level of confidence from one that remains attractive across realistic scenarios.
The baseline is the most credible alternative to the proposed change, often continuation of the existing program. We don't assume the lake will deteriorate just to make an intervention look worthwhile. Where future loading or treatment durability is uncertain, the comparison should show how much that uncertainty changes the investment decision.
Present value makes the timing of expenditure explicit
Net present value (NPV) is the present value of benefits minus the present value of costs over a common period. If the alternatives deliver equivalent benefits, their present costs can be compared directly. If their outcomes differ, a cost-only comparison is incomplete. Future costs and benefits are discounted to the same starting date, with consistent assumptions about inflation. [11]
For illustration, $100,000 paid at the end of each year for ten years has a present cost of about $811,000 at an illustrative 4% annual discount rate. A $1 million payment today has a present cost of $1 million. Both have the same undiscounted total. The approximately $189,000 difference comes from payment timing; it's not a forecast of lake-management savings.
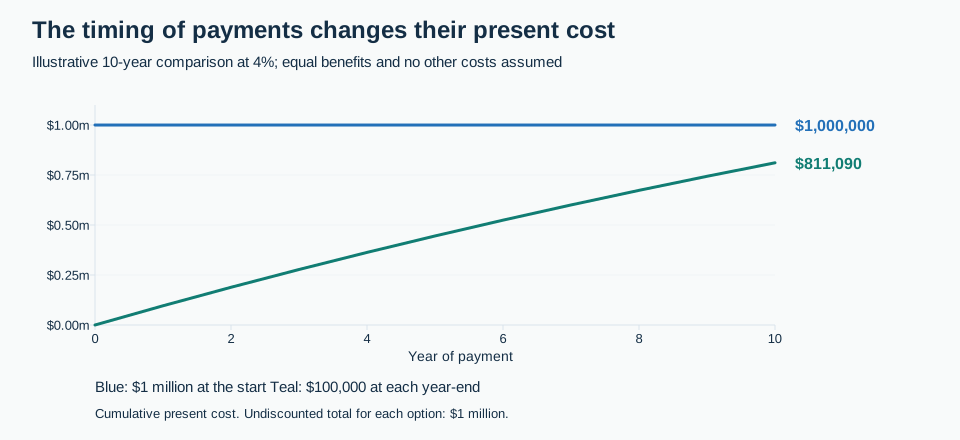
| Payment pattern | Undiscounted total | Present cost at 4% |
|---|---|---|
| $1,000,000 at the start | $1,000,000 | $1,000,000 |
| $100,000 at each year-end for 10 years | $1,000,000 | About $811,000 |
Illustration only: equal benefits and no additional costs or residual asset value are assumed. The 4% rate is an example, not a prescribed project discount rate. ENV calculation using standard discounting; not a project quotation. [11]
Adaptive management can add value beyond deferring payment. Evidence from an early stage can change later scope, prevent an unsuitable expansion, or avoid spending once the objective has been achieved. That flexibility is especially valuable when uncertainty is material and interventions can be adjusted without sacrificing the required outcome. [3]
A large intervention can still have the higher NPV when it provides substantially better performance, avoids major recurring costs, achieves an urgent objective, or remains useful over a long life. Staging can also add mobilization costs or delay benefits. We compare those consequences explicitly, including replacement, maintenance and any residual asset value, and test whether the preferred option changes under plausible assumptions. The advantage of adaptive management is a disciplined opportunity to improve the next investment, not a rule that smaller expenditure always wins. [1]
We present financial results with the scientific assumptions that support them. That allows a board, utility, or owner to understand both the expected benefit and the conditions under which the recommendation would change.
Case studyEvidence for an oxygenation investment
An oxygenation assessment at a large urban tidal lake in California addressed a practical investment question: whether the observed water-quality benefit justified expansion, and where that expansion would be most useful.
ENV compared oxygenated and comparison areas and examined operating and non-operating periods. The project record reports roughly one-third lower chlorophyll-a in oxygenated areas and an approximately two-week early-warning interval for oxygen depletion associated with a measured turbidity pattern.
Those observations supported a more informed expansion decision than equipment operation alone. They describe this project's response; a financial return for the expansion would also require its cost, operating period, useful life, and the value of the outcomes. The assessment identified the water-quality benefit on which that next comparison could be based.
This is the role of independent evaluation in a management budget: establish what the intervention is accomplishing, identify its limits, and use that evidence to guide the next commitment.
References & resources
Research and technical guidance supporting this guide. Advisory and regulatory information checked September 2026; local requirements may differ.
- U.S. EPA (2024). Guidelines for Preparing Economic Analyses, 3rd edition. ↩
- Mamun et al. (2023). Valuing water quality in the United States using a national dataset on property values. ↩
- Williams, Szaro & Shapiro (2009 printing). Adaptive Management: The U.S. Department of the Interior Technical Guide. ↩
- U.S. EPA (2024). Section 319 Grant Guidelines. ↩
- Huser et al. (2016). Longevity and effectiveness of aluminum addition to reduce sediment phosphorus release and restore lake water quality. ↩
- Singleton & Little (2006). Designing hypolimnetic aeration and oxygenation systems: A review. ↩
- Davison (1993). Iron and manganese in lakes. ↩
- Jüttner & Watson (2007). Biochemical and ecological control of geosmin and 2-methylisoborneol in source waters. ↩
- U.S. EPA (current guidance). Summary of Cyanotoxins Treatment in Drinking Water. ↩
- U.S. EPA (1999). Enhanced Coagulation and Enhanced Precipitative Softening Guidance Manual. ↩
- U.S. EPA (2024). Chapter 6: Discounting Future Benefits and Costs. ↩
Let's talk about your lake management budget
We can review current spending and performance, compare proposed investments, or develop a management plan with clear costs and success measures.
A conversation can start with what you've observed. We can review budgets, proposals, and past treatment results together to compare the next investment with the outcomes you need.
Schedule a conversation